Making a good infographic takes lots of time and work. Or does it? Well, we’re here to show you how to do it way easier and quicker.
Take a look at our list of the best apps to make infographics on your Android gadget. These apps offer multiple templates you can use to make pro-looking infographics with little to no effort. The apps let you customize all the details about the templates, so you can get a fully unique design. Some of these apps even let you make complex presentations if needed. Let’s dive in!
Infografz

This is one of the most traditional and easy apps for creating infographics. Its friendly and down-to-earth interface makes Infografz very reliable and popular with students.
Here you can use a wide range of templates – more than 100. You can choose and combine any of them to make your own unique infographic masterpiece. There is an opportunity to check the content created by others. Maybe it will inspire you or give you some new ideas. While exploring the world of infographics, you can also learn a lot.
If you like some of the works, you can download them on your phone and use them as a template. Editing is also possible if needed. All the infographics are classified by themes and topics. This will help you to find everything you need easily and fast.


You may also like: 11 Free Brochure Maker Apps & Websites
Timeline Infographic

As you may guess by the name, this app is dedicated to one form of infographics: a timeline. It visually displays any info in a time progression form, and there are lots of ways how you could use it.
Usually, a timeline infographic is most used in financial and strategic reports, and it’s also a great addition to your presentation (regardless of the topic). You can use it to give an overview of smth that is easy to follow.
This app offers multiple templates you can use as a base. All the elements are adjustable: you get to change shapes, colors, text, and all that. You can easily create an entirely unique infographic, but you can also simply log your info into a pre-made one.


Canva

It was not initially designed to be an infographic creator app, but Canva is so packed with functions that it can be used for practically everything including schemes, presentations, and, of course, infographics.
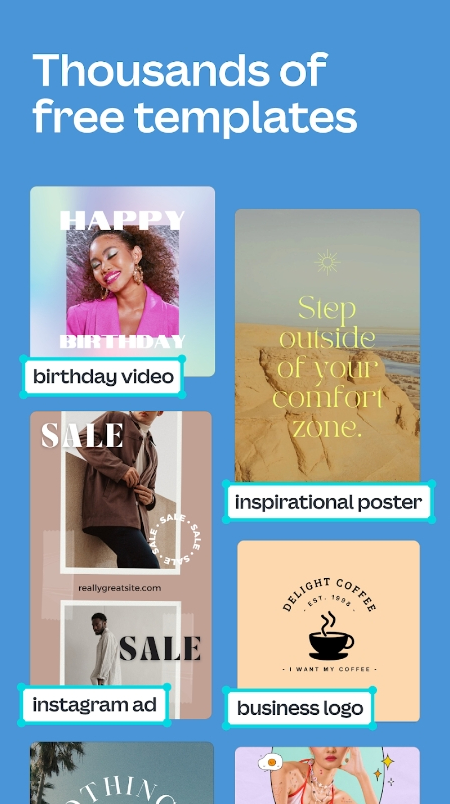
Canva is not as easy as most of the apps listed here, but the variety of functions it presents is impressive. An enormous number of templates can be used for free. Another nice feature is that you can download all the things you have created in PDF or web-optimized JPG.
You don’t need to use other apps for converting, Canva will do it automatically. There are no bugs or malfunctions that could potentially spoil your working process. By the way, Canva is perfect for creating content for social networks, such as Instagram, Twitter, and Facebook. You can share your infographics right after you create them.


Desygner

Another multifunctional app, which is effective and easy to use at the same time. It was created for making various designs, as you could have understood from the name.
Still, this application turned out to be a good tool for creating infographics. You should find the templates that are in the app (or import your own from the Net). Then it is possible to make any type of infographic: mind maps, schemes, and charts. You can combine them into one as well.
Another nice thing is that you can work collectively in this app. Invite your friends to Desygner and edit, add, and share your infographic together. This app has a reputation as the easiest program. It is logical, as Desygner was initially created for non-professionals. It is good for creating postcards and invitations as well.


Wepik

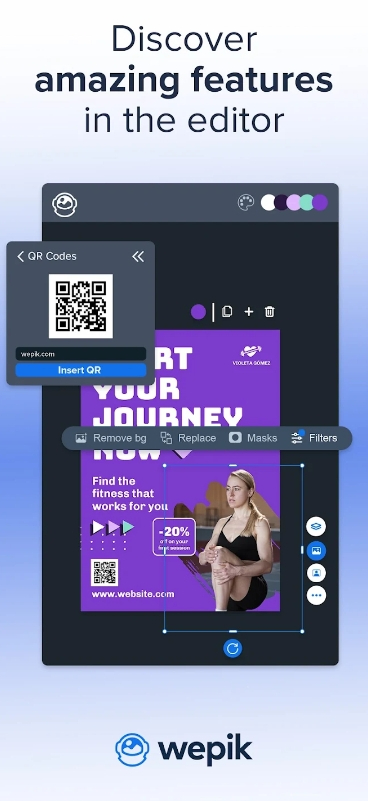
Here’s an app that lets you make stunning designs on the go. It’s a professional editing tool you’ll always have on hand to make a quick design. It offers multiple templates for all kinds of graphics possible, so you’re all the way covered.
All the templates are fully customizable and the editor is fully intuitive and beginner-friendly. Overall, this app is a great alternative to Canva in case you’ll ever want to try some new templates. This one is not that complex, though, but sometimes less is more.
It also features a huge photo lib you can use for your projects. It even has a built-in AI that turns your text into an image. There’s also a built-in background remover if needed.


VistaCreate
It’s a fully-featured design platform with tons of free templates you could use. The best thing about this app is it doesn’t require any editing or design skills. You can simply pick a template you like, log your text, replace the images, and you’re ready to go.
Overall, there are over 100K templates to use, and most of them are free. The app has a huge lib of images, vectors, and all kinds of decorations you may need to add to your infographics.
And if you’ll need to try smh new, the app covers formats for any business or personal needs. There is a bunch of templates for social media, marketing, video, branding, and all that. You’ll also get to save your project and use them as templates later.


Check also: 11 Best Watermark Remover Apps
Xmind

This app is fully dedicated to mind mapping. And if you’re not familiar with this type of graphics, it works best for brainstorming, visualizing your ideas, and creating a full-on map of any project you have in mind. It’s also great when you need to capture your ideas on the go.
There are over 30 templates you could use, so even if it’s your first time making such a map, you’ll do great. Along with classic designs, there’s a full pack of hand-drawn style maps in case it’s your vibe.
You’ll get to change everything about the map from structure to notes, and there are plenty of options for you to try. There are pre-made color schemes, skeleton varieties, and more.


Simple Graph Maker

While creating infographics you might need to present some statistical data. The best way to do it is to make a graph, which will reflect all the results you have.
The number of graphs is impressively big. There are pie charts, diagrams, and many other interesting templates. You can choose the size, shape, and color. Combine them to highlight the most important facts.
The app is really simple, as it’s clear from its name. The only downside that it has is that the number of functions isn’t really big. But it has all the basic things that are used for creating an infographic.


Mindly

This app is also more of a graph and mind map maker, but it can be very useful for creating infographics. There are many strong points that make the app very reliable. First of all, Mindly has a very good function in designing mind maps.
They will never look boring and grey. Designing is a function that is usually neglected by app creators, but Mindly is different. The number of elements is limitless, so you can create the most complex and complicated mind maps. This is perfect for giving a talk, making a presentation, or a huge note for the discipline you’re studying.
There is an opportunity to work in a group. The only thing you need is an email. After you register, you can create a collective mind map and edit it with your friends or classmates. Security is on a high level. You can set a password if don’t want other people to see your data.


Business Model Canvas & SWOT

Should you need to analyze the efficiency of your business and present this information, this app will be a good tool for doing this. The app is aimed at presenting information about the business, the economy, and money. All the templates it has been united by this topic.
The app has some schemes that are made especially for this. The only thing you need to do is to fill in the info. Another thing that this app can be good for is planning. If you dream about opening a café or starting up your online shop, you can use the app to sketch a business model.
Then you can download it in PDF or print. There is a possibility of saving your infographic models right in the app or sharing them via Facebook or e-mail.


You may also check: 11 Free Slideshow Maker Apps & Websites
Adobe Illustrator Draw

You might think that this app falls off the list, but it is not true. The infographics that you can create here, will be the most original ones, as you will draw the templates yourself.
This is a perfect option for those who want to be unique in creating something new and who thinks outside the box. But if you doubt your drawing skills, it is possible to download the templates, shapes, and details from the Internet.
You can download the infographics in PDF or web-optimized JPG. You may save them in the app as well. Another nice thing is collective work. Invite your classmates and colleagues to join you and edit the documents.
There is an Adobe Stock, where you can find a huge number of photos and images that will embellish your project or infographics. The Stock is constantly being updated. You can find any image by typing the keyword in the search line.


