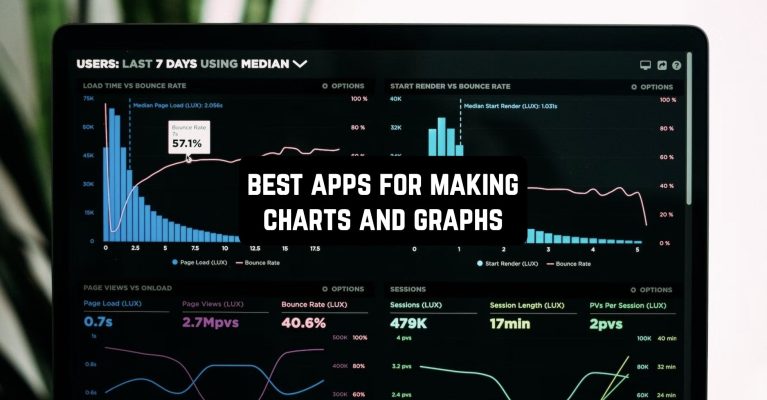
Creating charts or graphs can be a real headache if you don’t have special helpers. This is an acute problem for users of smartphones or tablets.
Yet, developers have come to the rescue and created excellent services, among which we have chosen the best apps for making charts and graphs on Android & iOS. Their main advantage is that they provide access to ready-made templates. All you have to do is select the type and enter all the necessary data.
Demonstrate your awesome charts and graphs to your audience with these free presentation apps for students.
Lucidchart

Lucidchart allows you to create and view charts and graphs. You must create an account to be able to work in the app. Registration will not only allow you to create and edit but even export your work.
For user convenience and the ability to organize teamwork in real-time, the app offers to use the cloud service. You will be able to create and edit, view, and comment on documents.
Users have a large selection of figures, diagrams, and flowcharts available for any situation or workflow. One of the advantages of the app is its universal compatibility. Supports most browsers and operating systems, as well as VDX, VSD, VSDM, and VSDX formats.
Allows integration with Microsoft Office, Microsoft Teams, and other apps. All this makes the work in the program as convenient as possible. You can easily export the results of your work and send them to the people you are interested in by mail.
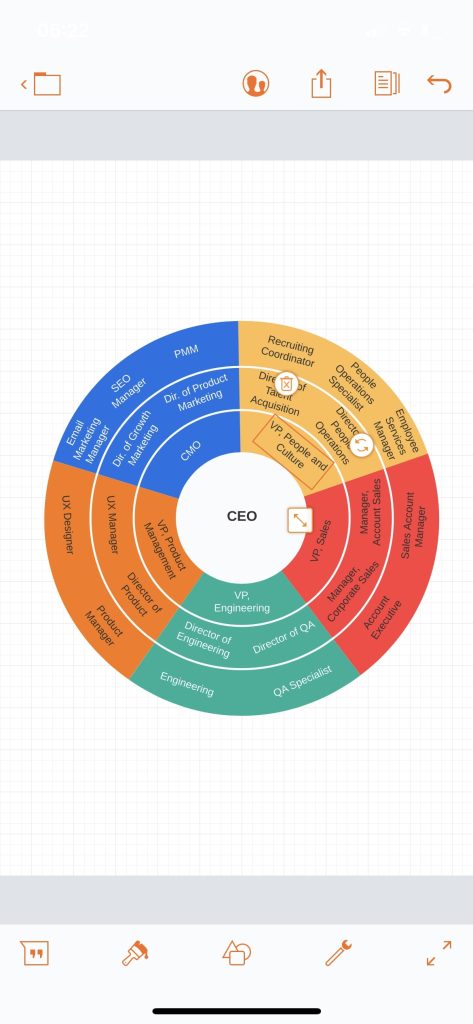

It is also possible to publish links to share and work with the document. The app is multifunctional and of high quality. It meets the declared characteristics.


You may also like: 11 Best apps to make infographics on your Android gadget
Chart Maker Pro

Chart Maker Pro is an app for creating charts and graphs. Quality, intuitive interface. Using the program is easy enough.
The first step – you enter your data into a special table, which is available in the app. The second step is to choose the desired or preferred type of chart or diagram.
The program provides support for various charts and graphs: histograms, pie charts, spline diagrams, and others. The possibilities of the utility are not limited to this. Once created, you can continue working with the chart.
Try transforming it, coloring it, or making other additions. It’s easy to save the results in the gallery. Share them with your stakeholders so they can appreciate the results of your work. Students and professionals who use charts and graphs in their work will appreciate the power of the app.


If you’ve never used charts, be sure to try this way of processing information. It is proven that information in the form of graphs and charts is easier to perceive and remember. Complete your texts with them and check the results.

Track & Graph

Track & Graph is a free app for creating graphs. It doesn’t collect or send your data in the process. It is easy and fun to use. Great for those who want to structure and keep under control all areas of their lives.
A distinctive feature of the program is the purpose of creating graphs – control and analysis of personal indicators. Just enter the data and a graph or chart is ready.
To optimize the process, you can set the parameters of several responses, and it is these values that will be reflected in the graph. You can use the graphs to track your health, workout, or training results.
The process of quitting bad habits can also be visualized with a graph. Track your behavior to identify the causes of events or their correlations to each other. Pie charts will help you see and assess proportions.


The service allows you to set up statistics parameters and get a sample. This will allow you to analyze the dynamics of certain events in your life. Download the app and use its features to make positive changes in your life.

Chartistic

Chartistic allows you to create charts and graphs. Great interface and features of the app. It’s easy to use and very fun. If your job or studies involve creating presentations, the app is definitely for you.
If you’ve never used these tools to process information and complete your work, it’s time to give it a try. Bright, colorful, and informative charts and graphs help you get your message across better.
Such works arouse interest and are well remembered. Some people refuse this kind of information presentation because creating charts and graphs is long and complicated. With the app, this problem is solved, and without any difficulty and a lot of time.
Easily create the charts and graphs you need, and make adjustments if necessary. Exporting as images will allow you to supplement any work with your colorful and informative charts and graphs.

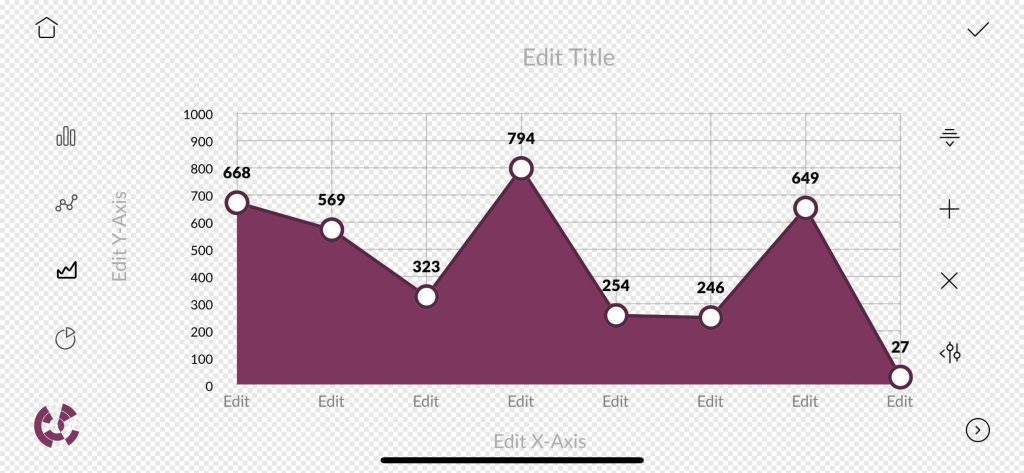
It can be not only a presentation but also training materials, e-mail correspondence, analytical data, and much more. Download the app and use its capabilities to improve the quality of your work or the information provided.

3D Charts

3D Charts is an app for creating 3D charts. No ads, just space to work and experiment with shapes.
The process of creating a chart takes less than a minute. Users have the ability to create almost any kind of chart. Create a classic percentage chart with the app – circular, cone or cylinder-shaped, and others.
For the more advanced and demanding, there are a number of combination charts and paddle charts. It all depends on the task before you and your preferences. In addition to 3D diagrams, it is also possible to create 2D diagrams.
The results are easy to export and share with the audience. The ability to export in high-quality PNG with transparent background will be of interest first of all to designers.


They will be able to appreciate this function of the service and use it in the process of their work. But representatives of other professions, whose work involves the creation of diagrams, will be able to appreciate all the possibilities of the app. You do not have to worry about the security of your data.

PieChart Maker

PieChart Maker is the app that allows you to create pie charts. An indispensable assistant in the preparation of presentations and other types of work that require this type of graphical support.
It is fun to work with the program. You can create any kind of pie chart. The process itself takes little time. You only need to enter the parameters and color of each parameter of the chart.
It is possible to edit the created chart. With the visualization function, you can observe in real-time how your chart changes during the process. It is easy to save the created charts. This will allow you to return to them at any time and make changes.


The preview function will allow you to evaluate the result before you export it. Users have the ability to export the data of the created chart to excel programs. This is convenient and speeds up the workflow. If you need to create a pie chart, take advantage of the features and benefits of the app.

You may also like: 11 Best Exam Preparation Apps for Students (Android & iOS)
Chart Maker – Create graphs and charts

Chart Maker is an app that helps you create charts, bar graphs, and graphs. The interface is intuitive and easy to use. Creating a chart or graph takes very little time.
All you have to do is enter the data and select the type of graph. The app allows you to create line graphs, vertical and horizontal bar graphs, ring and pie charts, and other types.
Even if you’ve never done this kind of work before, there will be no difficulty. All of your charts are conveniently stored in the app. You can return to them at any time to review, export, or make adjustments.
The app allows you to print the schedule directly from your phone. This allows you to work quickly if changes have been made to the schedule or extra copies need to be printed.


It’s easy to share the schedules you create with those interested – email them or post them on social media. Comments on your work will make sure you’ve chosen the right program.

Professional Charts

Professional Charts is an app for creating charts and graphs. Easy to use, with professional quality charts. With the app, you will easily create a line or paddle chart, a bar chart, a bubble chart, and many others.
It is possible to choose the color of the charts, the size, and the color of the text. Parameter settings will help you optimize your workflow. Set them and save them.
Next downloads of the utility will match your settings, you will not need to be distracted and waste time. A distinctive feature of the app compared to similar ones is the ability to create custom labels and limit lines.
Use a marker to indicate a specific value on the chart. You will also be able to select an axis and display it on the chart, to enable and disable grid lines on it. It’s easy to save your work and also to share it with interested parties.


It’s well known that information in the form of a graph or chart is easier for the audience to understand and remember than text. Take advantage of the app’s capabilities to make your work more professional, interesting, high-quality, and vivid.

Graph Generator

Graph Geneator is an app for creating various graphs. The service is easy to use. It offers a free period of use, then a paid subscription.
The graphics and interface are great. With the app, it is easy to create the desired form of a graph. It can be a line or pie chart, candlestick chart, and many others.
You will be able to enter the name and content of the chart and adjust its image and movement. An indispensable helper for high school and college students.
The app will also be useful for those whose work involves processing and providing information in the form of charts. You can not worry about losing some data or the result of the work – there are backups in the process.
All of your data is automatically backed up and stored in the cloud. If there is any glitch in your work, simply restore the latest saved version. Users have the ability to protect important or sensitive information with a password or biometric lock.
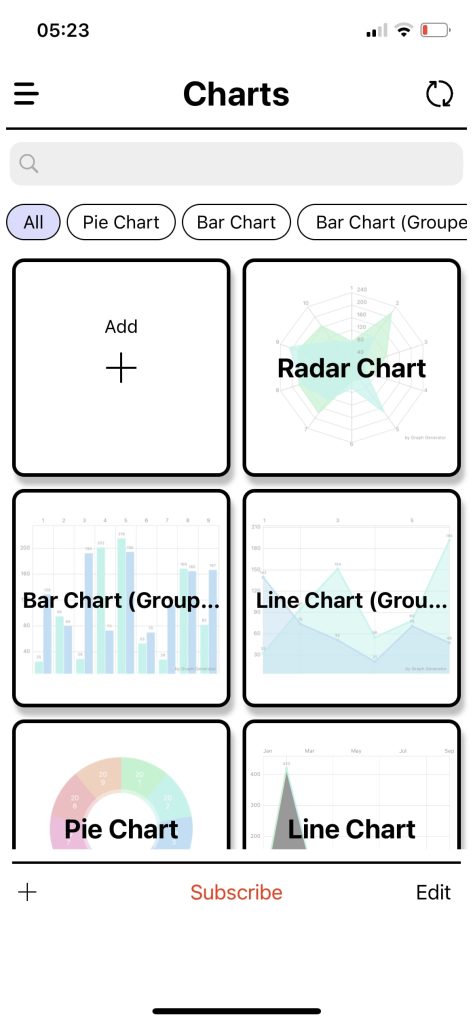

The advantages of the program are the absence of any advertising and unlimited export of graph generation. This provides a user-friendly experience and increases user loyalty.

Graph Maker (line/bar/pie)

Graph Maker is an app that allows you to create charts. It appeared on the market relatively recently, it is regularly updated with regard to user requests. The program is convenient.
It perfectly solves the stated tasks. If your occupation involves the need to process and provide information in the form of a graph, the service will be a great tool. It allows users to create a graph from specified binary data.
It will be created automatically. You can work with the following paired values: category and quantity, category and category, and quantity and quantity.
In the parameters category – quantity pair, you can create pie charts and scatter charts. This will allow you to process and visualize, for example, the sales of certain groups of products. In the pair quantity – quantity it is advisable to create a line or point chart.
The pair category is perfectly visualized with the help of a bar chart with the initial data and cross-table. Processing the information of this group allows you to visualize the relationship between the selected categories. If you only need to process and visualize quantitative data, use the histogram.


The app does an excellent job with each of the above tasks. All work is easy to save in CSV format. Exporting graphs is possible in PDF format.

You may also like: 11 Free Time Management Apps for Students (Android & iOS)
Radar Chart

The Radar Chart app allows you to create charts for printing. There are no difficulties in the process of use, everything is simple and clear.
An excellent assistant for the preparation of presentations and other projects that require high-quality visual support. A large number of charts, bar graphs, and diagrams are available for selection.
There are more than ten charts alone, including interactive ones. The program allows you to create normal types of charts and combined types of charts. The user has to select the type of chart, and the color and enter the parameters.
The result is easy to save, send by mail in PDF and PNG formats, or print. Everything happens almost instantly, which increases the efficiency of the work or study process. Adjustments can be made to the saved work.

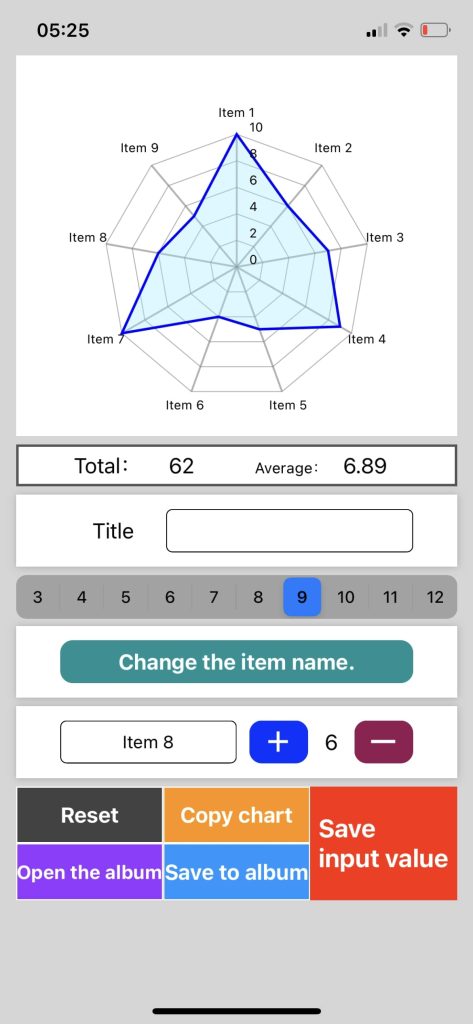
The app provides language support. Available languages are English, German, Chinese, Arabic, and others. Data is exported and imported in CSV format. If creating charts is part of your work or training process, download and evaluate the capabilities of the service.

